
The OTT users might reach 5.27 billion users worldwide, looking at the platform’s growth and subscribers.
The market revenue of OTT is estimated to go beyond $351.06 billion. The COVID-19 pandemic accelerated this growth, adding approximately 800 million new users during lockdowns.
Major platforms like Netflix, Amazon Prime, Hulu, and Disney+ continue to dominate the market.
Further, go through these detailed statistics to understand the OTT viewers, market growth, revenue, user behavior, and much more.
Top OTT Statistics For 2026
- The number of OTT users is estimated to have reached 5.27 billion.
- The market revenue of the OTT industry is over $351.06 billion.
- Users spend 17 hours streaming online video content weekly on OTT platforms.
- Americans spend an average of 3 hours and 9 minutes daily (or 21 hours a week) on OTT platforms.
- Over 70% of OTT users binge-watch content.
- The OTT Video Advertising market segment is expected to have a volume of $176.60 billion.
- Netflix leads with 301.6 million subscribers worldwide as of 2025.
- Disney+ has 127.8 million subscribers globally in Q3 2025.
- Hulu reached 55.5 million paying subscribers in Q3 2025.
How Many People Use OTT?
The number is estimated to have reached 5.27 billion with a rapid increase. The COVID-19 pandemic played a significant role in increasing this popularity.
During the COVID lockdown, the number of OTT users grew by approximately 800 million.
1) The Number Of OTT Users Are Estimated To Have Reached 3.92 Billion
The number of OTT users was 3.74 billion in 2023. This was a growth of almost 200 million compared to the previous year.
Further, OTT users are expected to reach 4.91 billion by 2029. That is a growth rate of 25.46% between the forecasted period of 2024 and 2029.

Here are further details about the number of OTT users recorded over the years:
| Year | Number of OTT Users |
|---|---|
| 2029* | 4.91 billion |
| 2028* | 4.72 billion |
| 2027* | 4.52 billion |
| 2026* | 4.33 billion |
| 2025* | 4.12 billion |
| 2024 | 3.92 billion |
| 2023 | 3.74 billion |
| 2022 | 3.53 billion |
| 2021 | 3.67 billion |
| 2020 | 3.46 billion |
Source: Statista
2) Ad-Supported Videos On Demand (AVOD) Users Will Decrease To 8.9 Million
The number of AVOD users will decrease in upcoming years.
Meanwhile, in 2023, AVOD users grew by 1.4 million compared to the past year.
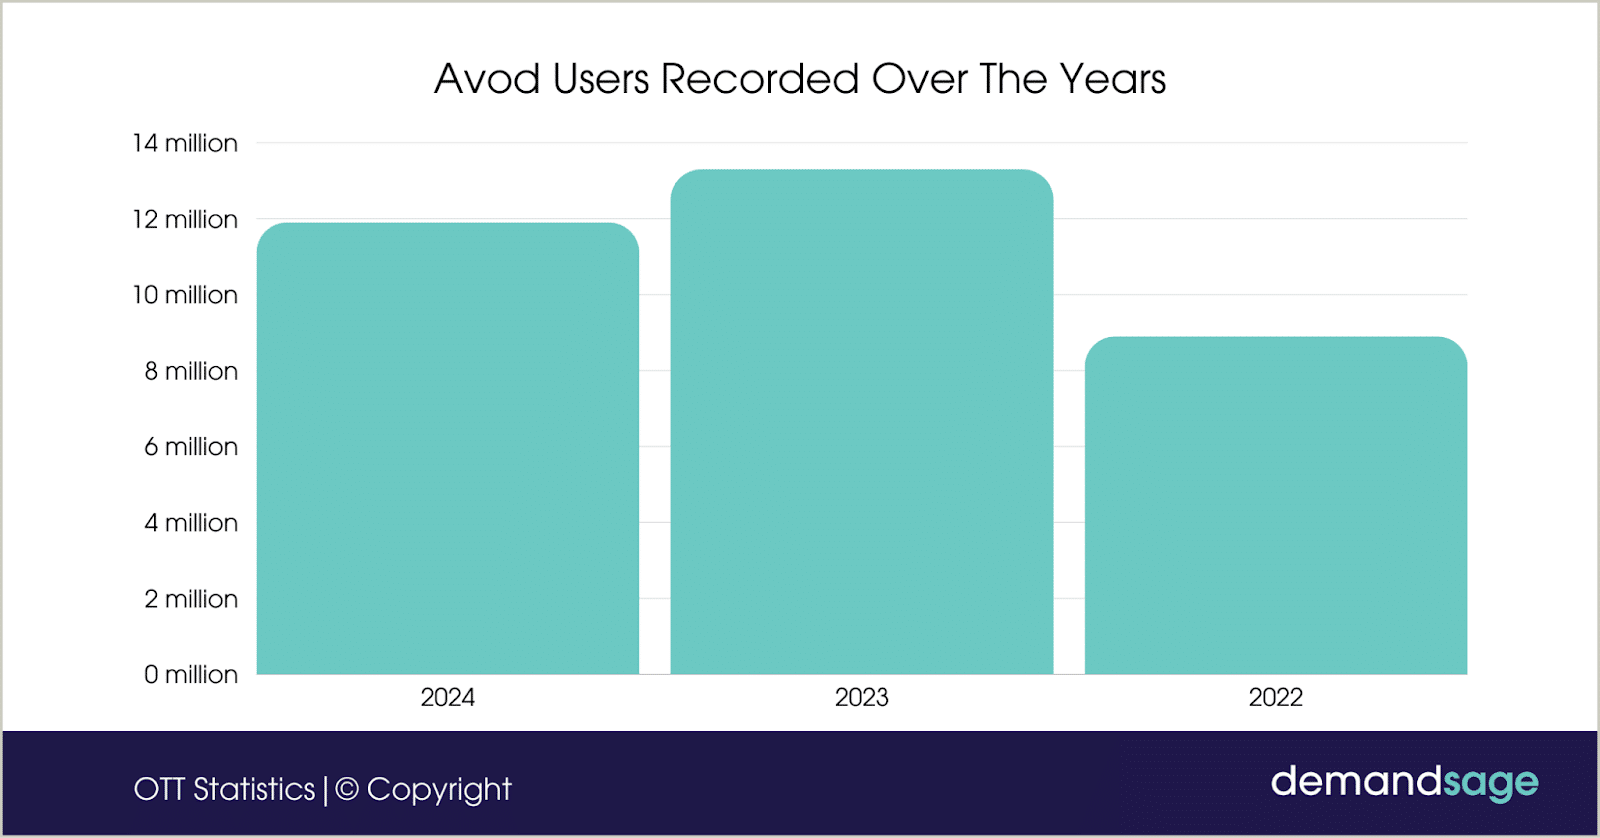
The following table displays the number of Ad-supported video-on-demand (AVOD) users recorded over the years:
| Year | AVOD Users Recorded Over The Years |
|---|---|
| 2024 | 11.9 million |
| 2023 | 13.3 million |
| 2022 | 8.9 million |
Source: Insider Intelligence
OTT Revenue Statistics
The OTT revenue witnessed a major jump between 2018 and 2021. Factors like COVID-19, affordable OTT services, and more drove this growth.
However, in 2025, the revenue of the OTT market might cross $351.06 billion.
With increased usage of devices like smart TVs, Tablets, smartphones, and others, the OTT market revenue is anticipated to increase further in the upcoming years.
3) The OTT Market Revenue Worldwide Is Expected To Reach $351.06 Billion
With the growing OTT market, the revenue is projected to reach $523.49 billion by the end of 2030. Each year, the growth rate might grow by 8.32% till 2030.
Advertisements are the biggest part of the market, which makes up a huge $214.76 billion of the total revenue in 2025.
Here is the OTT market revenue of 2025 and 2030, with other values:
| Description | Projected Value |
|---|---|
| Total Revenue in 2025 | $351.06 billion |
| Total Revenue in 2030 | $523.49 billion |
| Largest Market Segment (2025) | OTT Video Advertising (US$214.76bn) |
| Largest Revenue Generating Country (2025) | United States ($154.65bn) |
| Total Users Expected by 2030 | $5.11 billion |
Source: Statista
4) The Average Revenue Per User Is Expected To Be $85.04
The average revenue per user (ARPU) is forecasted to reach $85.04 in the OTT video market.
This shows that ARPU has increased by approximately 5.38% from 2024, which was $80.70.

The following table displays the ARPU generated by the OTT over the past years and the projections till 2030.
| Year | ARPU Of OTT |
|---|---|
| 2025* | $85.04 |
| 2024 | $80.70 |
| 2023 | $77.00 |
| 2022 | $72.37 |
| 2021 | $64.53 |
| 2020 | $52.12 |
| 2019 | $42.46 |
* Projected
Source: Statista
OTT Market Growth Stats
Consumers increasingly demand access to on-demand content they can watch whenever and wherever they want. This has led to an explosive increase in the OTT market in recent years.
Here, we have provided detailed insights into the projected growth of the OTT market worldwide.
5) The OTT Market Is Expected To Have Reached $523.49 Billion
The global OTT market will reach is projected to reach $523.49 billion by 2030, with a CAGR of 8.32% from 2025.
Some of the top players in the OTT market are Netflix, Amazon Prime, Hulu, and Roku.
Source: Statista
Time Spent on OTT Platforms
The time users spend on OTT platforms peaked in 2022, with users spending 19 hours per week on streaming services. Users’ hours dedicated to OTT increased by almost 4 hours in 2019.
However, in 2023, the number of hours spent streaming on OTT services declined by 2 hours.
6) OTT Users Spend 17 Hours Streaming Online Video Content Weekly
This was a decrease of 2 hours compared to that recorded a couple of years back. OTT users then spent 19 hours watching the content on the video streaming platforms.
The average weekly hours spent on video streaming services increased from 10.5 to 16 from 2018 to 2020.
The following table displays the average time spent on the OTT platforms weekly:
| Year | Number of Average Time Spent On OTT Platforms |
|---|---|
| 2023 | 17 hours |
| 2022 | 19 hours |
| 2021 | 18 hours |
| 2020 | 16 hours |
| 2019 | 14 hours |
| 2018 | 10.5 hours |
Source: Statista
7) Americans Spend An Average Of 70 Minutes Daily On OTT Platforms
According to Insider Intelligence, the average time spent on OTT subscriptions in the United States was recorded to be 1 hour and 10 minutes.
This was an increase of 3 hours compared to 2021.
The following table displays the number of hours Americans spend daily on OTT platforms:
| Year | Hours Spent By Americans Daily on The OTT Platforms |
|---|---|
| 2022 | 70 minutes |
| 2021 | 67 minutes |
| 2020 | 62 minutes |
| 2019 | 51 minutes |
| 2018 | 44 minutes |
Source: Statista
OTT Penetration Rate
The OTT penetration rates display the adoption rate of OTT platforms among global users. Hence, according to the latest OTT statistics, almost half of the population that has access to the internet has adopted the usage of OTT.
Let’s take a closer look at the penetration rates of OTT recorded over the years.
8) The Global Penetration Rate Of The OTT Market Is Projected To Be 52.84%
The global penetration rate of OTT will increase from 52.84% from 2025 to 62.97% by 2030.
This increase in the penetration rates is due to the global adoption of smart devices and easier access to high-speed internet.
The following table displays the penetration rates of OTT recorded worldwide.
| Year | Global OTT User Penetration (%) |
|---|---|
| 2025 | 52.84% |
| 2026* | 54.87% |
| 2027* | 56.90% |
| 2028* | 58.93% |
| 2029* | 60.96% |
| 2030* | 62.97% |
Source: Statista
9) The OTT Penetration Rate Recorded In Canada Is 89.12%
Canada has the highest OTT penetration rate worldwide, followed by New Zealand.
In contrast, Belgium ranks 5th with a penetration rate of 78.6%, showing a difference of 10.52 percentage points to Canada.
Here are further details about the countries with the highest penetration rates.
| Country | OTT Penetration Rates |
|---|---|
| Canada | 89.12% |
| New Zealand | 85.27% |
| United Kingdom | 85.13% |
| Norway | 79.46% |
| Belgium | 78.6% |
Source: Statista
OTT Market Share
Netflix pioneered the OTT market, and the app still dominates. Almost 1 in 5 OTT viewers worldwide use Netflix daily to stream videos.
Disney Plus and Amazon Prime have also managed to gain popularity among OTT users.
10) Netflix Owns 44.21% Of The OTT Market Share In The United States
Netflix owns the highest share of the OTT video market in the United States.
It is a pure content-driven model and includes the latest web series, films, and other kinds of content.
Netflix is followed by Hulu, which has a market share of 21.18% in the country.
Other top competitors of Netflix in the United States are HBO Max, PeacockTV, Disney+, YouTube TV, etc.

The following table displays the market share owned by different OTT providers in the United States.
| OTT Providers | Market Share Owned By OTT Providers |
|---|---|
| Netflix | 44.21% |
| Hulu | 21.18% |
| HBO Max | 10.61% |
| PeacockTV | 8.08% |
| Disney+ | 6.40% |
| YouTube TV | 5.18% |
| Paramount+ | 4.34% |
Source: Similar Web
11) Roku Leads CTV Market With 46% Of Total Viewing Hours
As of August 2025, Roku dominates the CTV device market with 46% of total viewing hours, which is nearly half of all connected TV consumption in the United States.
| CTV Device Brand | % of Total CTV Viewing Hours | Key Products |
|---|---|---|
| Roku | 46% | Roku Streaming Stick, Roku Ultra, Roku TV |
| Amazon | 14% | Fire TV Stick, Fire TV Cube |
| Samsung | 11% | Samsung Smart TVs (Tizen OS) |
| 5% | Chromecast, Google TV | |
| Other | 24% | LG, Apple TV, Vizio, etc. |
Amazon Fire TV holds the second position with 14% of viewing hours.
The top three CTV platforms (Roku, Amazon, and Samsung) collectively account for 71% of all streaming viewing time.
Google captures 5% of CTV viewing hours, while other smaller device manufacturers combine for 24% of the market.
Global OTT Content Market
The OTT content market has revolutionized the digital entertainment sector, offering diverse and on-demand content.
The rising adoption of smart TVs and connected devices is propelling the OTT content market size.
12) The Global OTT Content Market Will Reach $1.94 Trillion By 2032
The content market was valued at $204 billion in 2022.
Further, the market is expected to grow at a CAGR of 22.8% between 2023 and 2032.
Besides, North America led the OTT content market with over 39% share in 2022.
Source: Yahoo Finance
Advertising on OTT Platforms
The OTT Video Advertising market segment is expected to have a market volume of $189.60 billion.
These high numbers result from most brands preferring to advertise on OTT platforms. Most of the advertisements on these platforms are unskippable and play a major role in attracting the audience’s attention.
13) OTT Ads Typically Have 90% or More Completion Rates
OTT ads typically have higher completion rates because most devices and platforms feature non-skippable ads that are always in view.
This has raised the OTT ad completion rates to more than 90%.
Source: Tinuiti
14) 72% Of The People Watching OTT Remember A Specific Ad They Saw
Due to the increasing impact of advertisements on OTT viewers, 42% of marketing professionals and agencies are working on increasing their expenditure on OTT ads.
Source: OpenX
15) 66% Of People Who Watch OTT Video Content Discovered A New Product Or Service
Besides, 65% of OTT viewers look up product information on a second screen while watching their video content.
Further, 40% of the OTT viewers reported that they paused the OTT video content to research or purchase the product they saw in the ad while watching the content.
16) 57% Of U.S. Adults Prefer Low-Cost Or Free OTT Streaming Platforms With Ads
25% of OTT viewers said that they were happy to watch a 10-minute advertisement in exchange for the free video content.
Additionally, 40% of the total advertising video impressions are found while the users stream video on the OTT platforms.
OTT User Behavior
The OTT users portray different behaviors in different parts of the world. However, some basic habits, like the number of episodes streamed at a stretch, binge-watching, etc, remain the same worldwide.
Hence, this section will provide an overview of OTT usage worldwide.
17) Over 70% Of OTT Users Binge-Watch Content
OTT users watch an average of 5 episodes at a stretch.
This means that people watch their favorite series continuously without any breaks.
Besides, 88% of Netflix users binge-watch content, and 70% of the Hulu Plus users do so.
Source: Deloitte, Nielsen
18) 34.97% Of OTT Users Watch OTT Content Several Times A Day
This shows that many people occasionally access OTT services in their daily lives.
Besides, 74.89% of people access OTT at least three times a week, indicating that OTT deeply penetrates their lives.
Additionally, most people spend 20 to 60 min once connected to the OTT platform.
Source: MDPI
19) Subscribers Who Plan On Maintaining Or Adding To Their Subscriptions Were Recorded To Be 86% Of The Total OTT Users
61% of the OTT users said they plan to have the same subscriptions for the upcoming years. Meanwhile, 25% of the OTT users look forward to adding a new subscription.
On the other hand, 14% of the OTT users are looking forward to reducing their number of subscriptions.
Source: Unscreen.
Platform-Specific OTT Stats
As seen before, some of the top OTT platforms worldwide are Netflix, Amazon Prime, Hulu, Disney Plus, and others.
In this section, we will take a detailed look at the latest figures related to them.
Netflix
20) There Are More Than 301.6 Million Netflix Subscribers Worldwide
As of August 2025, Netflix has over 301.6 million subscribers worldwide. Netflix is expected to grow positively.
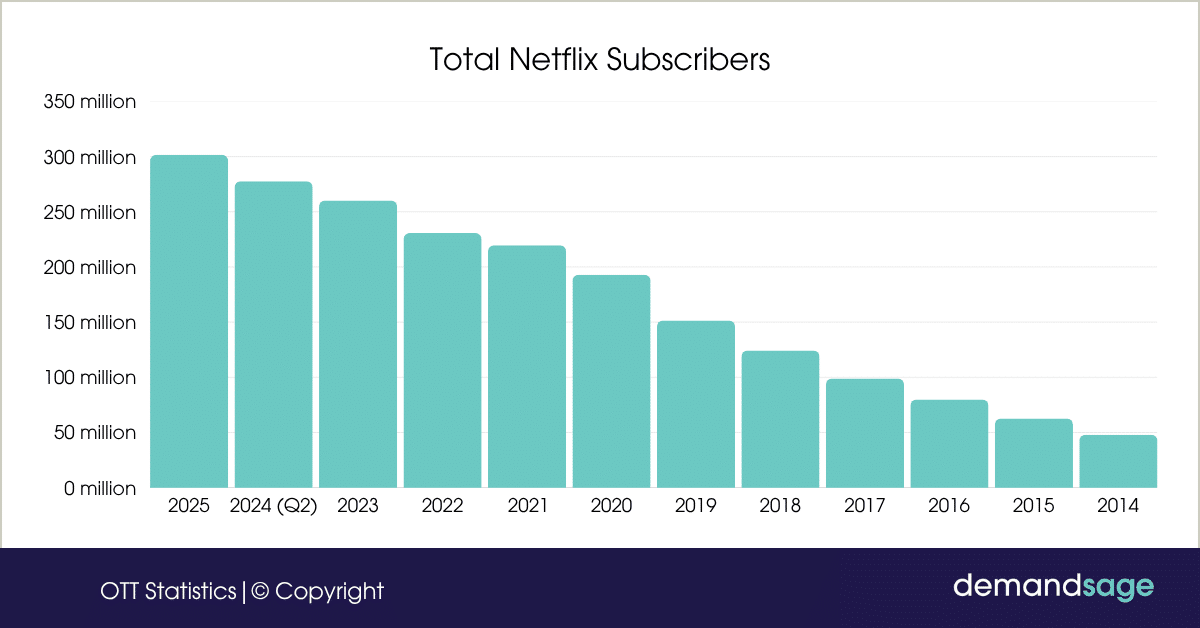
This rise in the subscriber count shot Netflix’s stock up by 13.8% in October 2023.
| Year | Number of Netflix Subscribers |
|---|---|
| 2025 | 301.6 million |
| 2024 | 277.65 million |
| 2023 | 260.28 million |
| 2022 | 230.7 million |
| 2021 | 219.7 million |
| 2020 | 192.9 million |
| 2019 | 151.5 million |
| 2018 | 124.3 million |
| 2017 | 99 million |
| 2016 | 79.9 million |
| 2015 | 62.7 million |
| 2014 | 47.9 million |
21) Netflix’s Ad-Supported Plan Has Around 190 Million Subscribers
Netflix’s ad-supported plan was launched on November 1st, 2022, for Canada and Mexico.
Later, on 3rd November, the plan went live for the United States, United Kingdom, Australia, France, Brazil, Germany, Italy, Korea, and Japan.
Currently, in just three years, Netflix’s ad-supported plan has gained more than 190 million subscribers.
22) Europe, the Middle East, And Africa Gather Around 83.76 Million Netflix Customers
They are the world’s largest Netflix markets. Plus, with 77.32 million members, the U.S.A. and Canada are second.
With 43.65 million members, Latin America ranks third.
In the Asia Pacific area, the streaming behemoth boasts 42.43 million subscribers.
23) Netflix Generated $33.72 Billion in 2023
As of Q2 2024, Netflix generated over $39.00 billion in revenue.
Netflix registered revenue of $8,542 million in Q3 2023. Additionally, it registered a revenue of $8,162 million in Q1 and $8,187 million in Q2 2023.
Netflix’s overall income in 2022 was around $31.61 billion. This is up from 1.67 billion dollars a decade earlier. The company’s net income in 2022 was $4.49 billion, with a total workforce of 11,300 people globally.
Netflix’s annual income has risen steadily in recent years. Here are further details about its revenue recorded in the previous years.
| Year | Revenue |
|---|---|
| 2024 | $39.00 billion |
| 2023 | $33.72 billion |
| 2022 | $31.61 billion |
| 2021 | $29.698 billion |
| 2020 | $24.99 billion |
| 2019 | $20.15 billion |
| 2018 | $15.79 billion |
| 2017 | $11.69 billion |
| 2016 | $8.83 billion |
| 2015 | $6.78 billion |
| 2014 | $5.5 billion |
Source: Netflix Investor Relation Letter
Amazon Prime
24) Amazon Prime Has Approximately 200 Million Members Worldwide
However, Amazon has not disclosed the figures after 2020. Hence, the number of Amazon Prime members must have crossed the number of 2100 million worldwide.
The number of Amazon users jumped by 100 million users in just 3 years between 2018 and 2020.
Besides, a vast majority of Amazon Prime members access the US marketplace.

Here is a table showing the number of Amazon Prime members recorded over the years.
| Year | Amazon Prime Members |
|---|---|
| 2020 | 200 million |
| 2019 | 150 million |
| 2018 | 125 million |
| 2017 | 100 million |
| 2016 | 65 million |
| 2015 | 46 million |
| 2014 | 31 million |
Source: MarketPulse
25) Amazon Prime Subscription Services Generated $35.22 Billion in Revenue as of 2022
Amazon generated a total revenue of 514 billion in 2022. This means that Amazon Prime’s total share of revenue was 6.85% in that year.
Besides, Amazon Prime’s revenue jumped from $19.21 billion in 2019 to $25.21 billion in 2020. This was an increase of $6 billion in just a year.
Here are further details about the Amazon Prime revenue recorded over the years.
| Year | Annual Net Sales Of Subscription Services |
|---|---|
| 2022 | $35.22 billion |
| 2021 | $31.77 billion |
| 2020 | $25.21 billion |
| 2019 | $19.21 billion |
| 2018 | $14.17 billion |
| 2017 | $9.72 billion |
| 2016 | $6.39 billion |
| 2015 | $4.47 billion |
| 2014 | $2.76 billion |
Source: Search Logistics
Hulu
26) Hulu has reached 55.5 Million Paying Subscribers in Q3 2025
In the third quarter of 2025, the Walt Disney Company reported that Hulu had 55.5 million paid subscribers.
It is increased from 51.1 million in the quarter of the previous fiscal year (Q3 2024). This represents a year-over-year growth of 8.6%.
The highest subscriber growth was recorded between 2020 and 2021, when the number of users grew by 9 million during this time, driven by the COVID-19 pandemic’s impact on streaming consumption
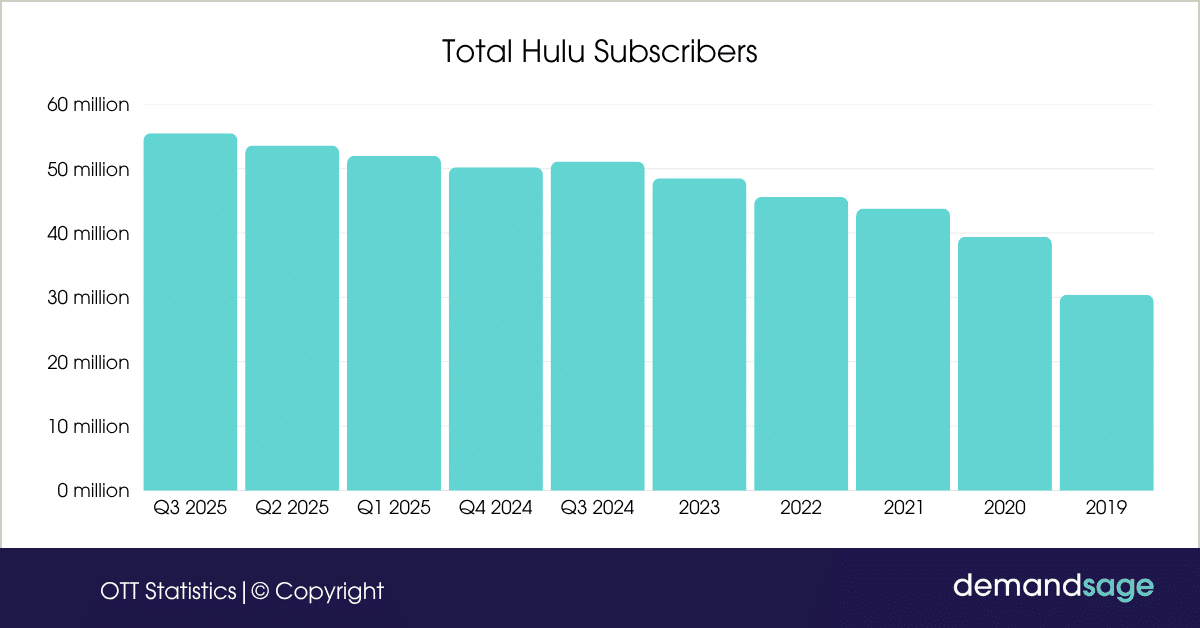
The following table will provide you with further details on the number of Hulu users recorded over the years.
| Year/Quarter | Number of Hulu Subscribers (in millions) |
|---|---|
| Q3 2025 | 55.5 |
| Q2 2025 | 53.6 |
| Q1 2025 | 52.0 |
| Q4 2024 | 50.2 |
| Q3 2024 | 51.1 |
| 2023 | 48.5 |
| 2022 | 45.6 |
| 2021 | 43.8 |
| 2020 | 39.4 |
| 2019 | 30.4 |
Source: Statista
27) Hulu Generated a Revenue of $11.2 Billion in 2023
This is a 4.6% increase compared to the previous year. In 2022, Hulu generated a revenue of 10.7 $billion.
Hulu’s revenue skyrocketed in 2020. The platform generated a revenue of Nearly $3 billion in just a year.
The following table provides further insights into the revenue generated by Hulu over the past years:
| Year | Revenue Generated By Hulu |
|---|---|
| 2024 | $12 billion |
| 2023 | $11.2 billion |
| 2022 | $10.7 billion |
| 2021 | $9.6 billion |
| 2020 | $7.2 billion |
| 2019 | $4.5 billion |
| 2018 | $3.5 billion |
| 2017 | $3.1 billion |
| 2016 | $2.4 billion |
| 2015 | $2 billion |
Source: Disney, CNBC, GeekWire, Business os Apps
28 ) Hulu’s Average Revenue Per User (ARPU) Reached $95.82 in Q1 2025
Hulu’s average monthly revenue per paying subscriber has shown steady growth over the years.
As of Q1 2025, Hulu’s ARPU stood at $95.82, reflecting the platform’s successful strategy of balancing ad-supported and premium subscription tiers.
Here’s the table of Hulu’s ARPU over time:
| Quarter | SVOD Only | Live TV + SVOD |
|---|---|---|
| Q1 2025 | $12.52 | $95.82 |
| Q4 2024 | $12.73 | $95.01 |
| Q3 2024 | $12.29 | $90.08 |
| Q2 2024 | $12.39 | $92.32 |
| Q1 2024 | $12.46 | $86.77 |
| Q4 2023 | $12.92 | $88.77 |
| Q3 2023 | $12.96 | $84.89 |
Source: Statista
The Walt Disney Company acquired full control of Hulu after purchasing Comcast’s 33% stake in November 2023, consolidating Disney’s streaming strategy under one corporate umbrella.
Disney Plus
29) Disney Plus reached 127.8 Million Subscribers Worldwide
As of June 28, 2025 (Q3 fiscal 2025), Disney+ had 127.8 million paid subscribers worldwide, representing a 1% increase from 126.0 million in Q2 fiscal 2025.
This includes 57.8 million domestic subscribers (U.S. and Canada) and 69.9 million international subscribers.
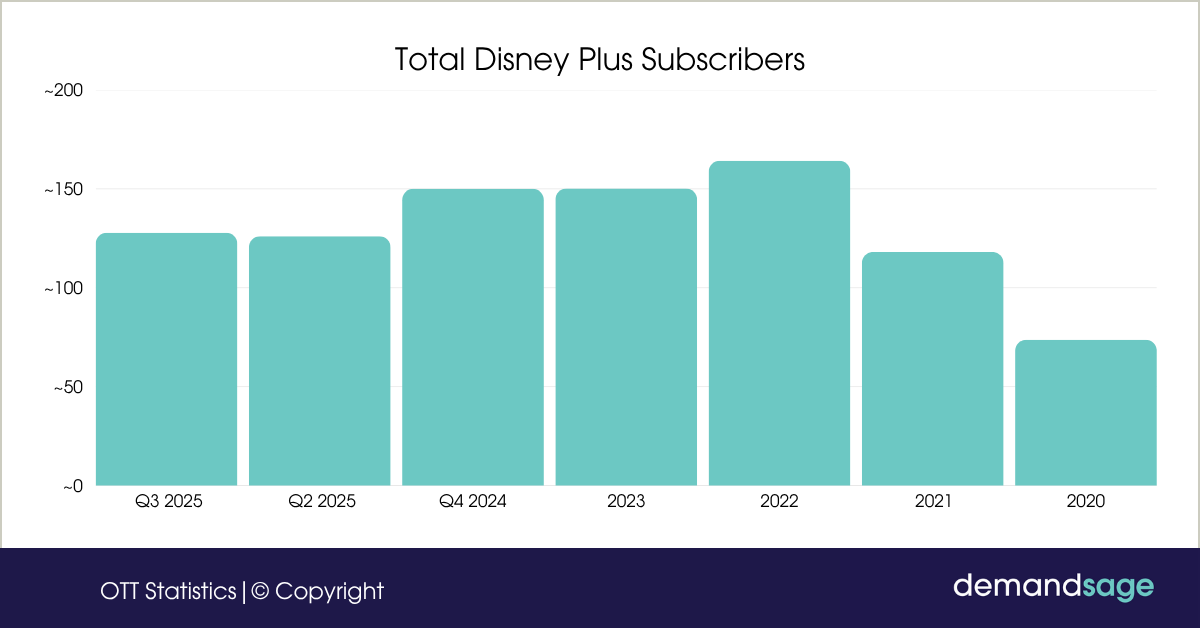
Here are further details about the Disney Plus subscribers recorded over the past years.
| Quarter/Year | Disney+ Subscribers (in millions) |
|---|---|
| Q3 2025 (Jun 28, 2025) | 127.8 |
| Q2 2025 (Mar 29, 2025) | 126.0 |
| Q4 2024 | ~150 |
| 2023 | 150.2 |
| 2022 | 164.2 |
| 2021 | 118.1 |
| 2020 | 73.7 |
Source: Statista
30) Disney Plus’s Annual Revenue Crossed $8.4 Billion in 2023
This is an increase of 13% in revenue compared to the previous year. In 2022, Disney Plus generated $7.4 billion in revenue.
The platform’s revenue jumped by $5 billion between 2020 and 2022.
The following table displays further information about Disney Plus revenue recorded over the past years.
| Year | Revenue ($bn) |
|---|---|
| 2020 | 2.8 |
| 2021 | 5.2 |
| 2022 | 7.4 |
| 2023 | 8.4 |
Source: Disney Reports
31) Disney+ Average Revenue Per User Reached $7.86 in Q3 2025
Disney+’s average monthly revenue per paid subscriber (ARPU) has shown steady growth as the company has implemented price increases and introduced an ad-supported tier.
As of Q3 2025, Disney+’s global ARPU stood at $7.86, up from $7.77 in Q2 2025.
| Quarter | Domestic ARPU | International ARPU | Overall ARPU |
|---|---|---|---|
| Q3 2025 | $8.09 | $7.67 | $7.86 |
| Q2 2025 | $8.06 | $7.52 | $7.77 |
International ARPU grew 2% quarter-over-quarter (from $7.52 to $7.67), driven by favorable foreign exchange impacts and pricing increases, while domestic ARPU remained relatively stable at around $8.09.
Disney’s entire Direct-to-Consumer segment (Disney+, Hulu, ESPN+) generated $6.18 billion in revenue in Q3 2025. They achieved profitability with $346 million in operating income, a massive improvement from a $19 million loss in Q3 2024.
Disney+ annual revenue has grown from an estimated $2.8 billion in 2020 to approximately $8.4 billion in 2023, representing a 200% increase in just three years despite subscriber fluctuations.
Conclusion: OTT Users Are Projected To Go Beyond 5.27 Billion
The OTT market is growing rapidly, with more than 5.27 billion users worldwide. The revenue of OTT is expected to cross $351.06 billion.
Netflix stays among the dominant platforms, with 44.21% of the market share among all other platforms, such as Hulu, PeacockTV, HBO Max, etc.
Overall, as the OTT platforms are grabbing the attention of the worldwide user’s it is projected that the market will rise only in terms of subscribers, revenue, and market share.
